


Every so often I hear someone say, “I raise my prices, and my clients still pay whatever I charge.” My first reaction? It must be nice. My next question? How do you know?
Just because clients are paying whatever one charges doesn’t mean there isn’t a sinking pit feeling in the stomach or a rush of thoughts flying through the brain about price increases. But hey, maybe they do know. Maybe they have the kind of relationship with clients where people have actually said, “We’ll pay whatever you increase.” I don’t know.
But what I do know is that whether you are that magic unicorn of a practice or you constantly think about pricing decisions and how they will impact your clients, those decisions should be thoughtful and backed with data. Good business owners don’t rely on anecdotes, they understand their clients, their constraints, and their willingness to pay.
In economics, willingness to pay (WTP) refers to the maximum amount a consumer is willing to pay for a good or service based on the value they perceive. That threshold varies across households over time and is shaped by far more than income alone. Consumers may feel constrained by budget realities, but they may also push back for non-financial reasons because a price increase feels unreasonable, misaligned with value, or simply “too much,” even if they technically could afford it. Heck, I’ve been there myself. Sometimes it’s just the principle.
And just as important, consumers don’t decide whether care is worth it in isolation. They decide whether your price is worth it relative to other options. That comparison across providers, alternatives, and substitutes is where WTP is ultimately revealed.
This applies to pet care just as it does to any other category of household spending. Pet owners allocate their budgets across food, toys, veterinary services, grooming, boarding, training, and more. But pet spending exists within a broader household budget that is already dominated by essentials. Consumer Expenditure Survey data from the U.S. Bureau of Labor Statistics indicate that pet-related spending typically accounts for roughly 1% of total household expenditures, a share that has remained relatively stable over time.
There are also important generational differences. For example, Generation X households tend to spend more on pet care services than Millennials or Baby Boomers, reflecting differences in income, life stage, and household structure. These differences matter when thinking about pricing power because willingness to pay is not uniform across client bases, even within the same community.
All of this is to say: there is a ceiling. Even in higher-income areas, even among deeply bonded pet owners, willingness to pay has limits.
Understanding your client base’s WTP helps answer critical business questions:
- Whether to raise prices
- How much to raise them by
- Which services are most price sensitive
- How to communicate price changes without eroding trust or demand
Price increases are sometimes necessary, but assuming clients will “always pay” ignores the economic reality that willingness to pay is shaped by value, alternatives, and constraints. Practices that understand those forces are far better positioned to price strategically, sustainably, and with fewer surprises.
Here’s where data can add some perspective. Looking at the veterinary services spending index (where 100 represents the national average) shows how households actually allocate dollars toward veterinary care across different markets. It’s not a direct measure of WTP, but it reflects real spending behavior. And what it shows is variation. Some areas spend well above average, others below, even when income and pet ownership levels look similar. In other words, income helps, but it doesn’t equal unlimited pricing power. Local market dynamics, access, competition, and perceived value all still matter.
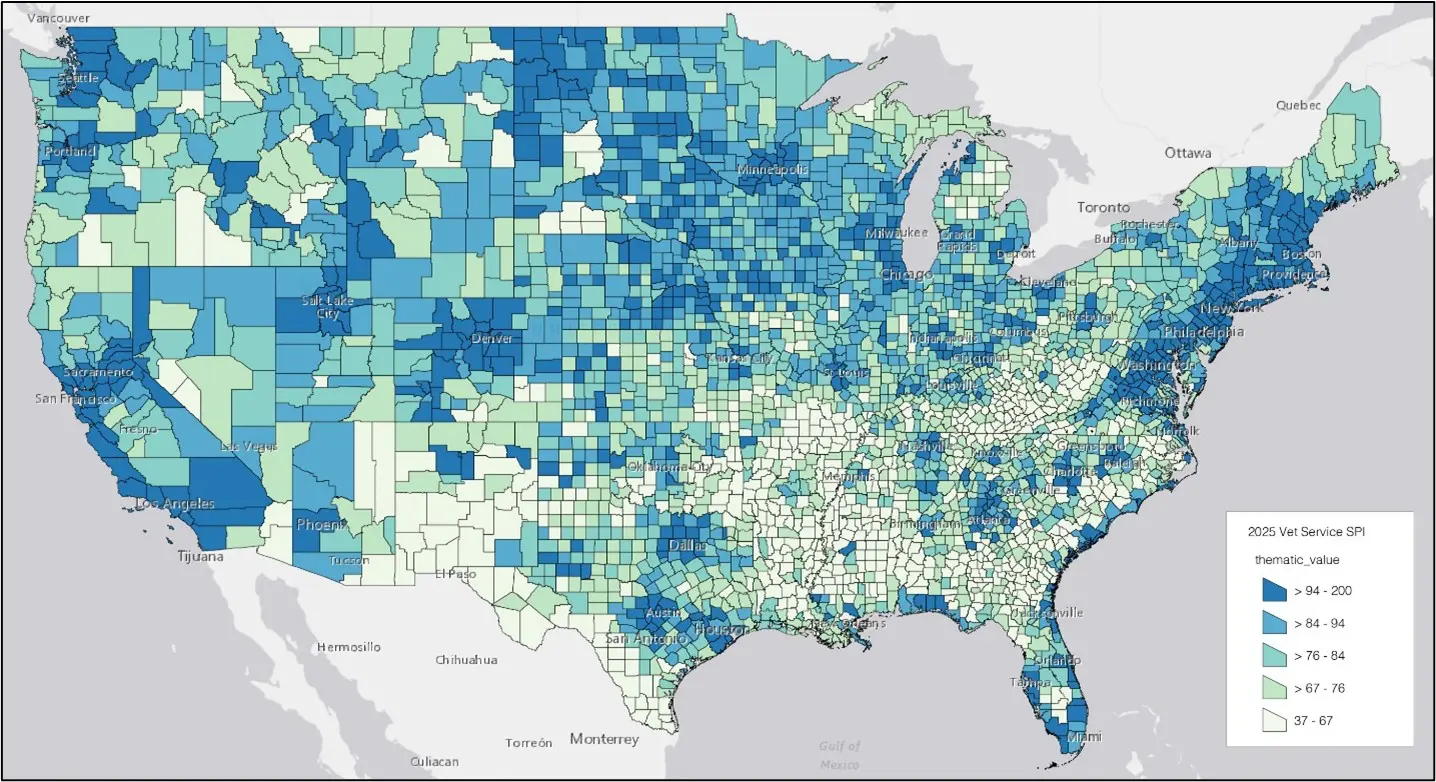
Click to expand • Source: Esri Business Analyst (2025). Veterinary Services Spending Index (SPI) reflects estimated household spending on veterinary services relative to the U.S. average (indexed to 100). Values above 100 indicate higher-than-average spending; values below 100 indicate lower-than-average spending. The index reflects observed spending patterns and is not a direct measure of willingness to pay.
If you’re a VMG member, you don’t have to estimate. Demographic reports on VMG Connect can show you exactly what your local market looks like. These resources provide a clearer picture of local income patterns, pet ownership, and spending behavior, helping practices move beyond assumptions toward more informed decision-making.
So instead of “my clients will pay anything,” maybe the more accurate framing is “my market supports a higher willingness to pay.” That distinction matters. Pricing decisions grounded in real market understanding, not anecdotes, tend to be more sustainable, less stressful, and ultimately better for both practices and clients. Income, pet ownership, local spending patterns, access, and even preferences and cultural norms all play a role. It’s not an exhaustive list, but it highlights how many factors shape WTP. Understanding those factors doesn’t mean you won’t raise prices; it means you’ll do so with confidence rather than assumption. And even if you don’t change pricing tomorrow, simply paying closer attention to how your market behaves can lead to better long-term decisions.
Written by Charlotte McKay